Key takeaways
- Variance analysis compares forecasted cash flows with actual cash flows to identify and explain the differences.
- It is typically performed weekly and helps teams find causes of forecast inaccuracies, such as late customer payments or unanticipated expenses.
- Variances are categorized as controllable or uncontrollable before corrective action is taken.
- Common drivers include changes in revenue collection, delayed payments, unexpected expenses, supplier terms, and forecast errors.
Variance analysis compares forecasted cash flows with actual cash flows to identify, understand, and explain the differences (variances). This analysis helps businesses assess the accuracy of their forecasts, improve future predictions, and take corrective actions where necessary.
Typically performed on a weekly basis, it often helps finance teams to identify specific factors causing forecast inaccuracies, such as late customer payments or unanticipated expenses. Combined with scenario planning, it ensures a robust approach to managing cash flow and making informed financial decisions. Together, they help businesses understand past discrepancies, anticipate future uncertainties, and prepare for a range of potential outcomes.
The variance analysis process step-by-step
- Gather data: Collect actual cash flow data for the period in question and compare it to the corresponding forecasted data.
- Calculate variances: Determine the difference between actual and forecasted amounts for each cash flow category (e.g., inflows, outflows, net cash position).
- Analyze variances: Investigate the causes of significant variances.
- Categorize by type: Separate variances into controllable (e.g., internal inefficiencies) and uncontrollable (e.g., economic changes) factors.
- Take corrective action: Address unfavorable variances where possible (e.g., improving collection processes, renegotiating payment terms). Use insights to refine future forecasts and assumptions.
- Report and communicate: Present variance analysis findings to stakeholders, highlighting key insights and actions taken.
Common drivers of variance
Below are some of the most common causes of variance between your forecast and actuals.
- Changes in sales or revenue collection.
- Delayed customer payments.
- Unexpected expenses.
- Fluctuations in supplier payment terms or costs.
- Errors or omissions in the original forecast.
How Atlar can help with variance analysis
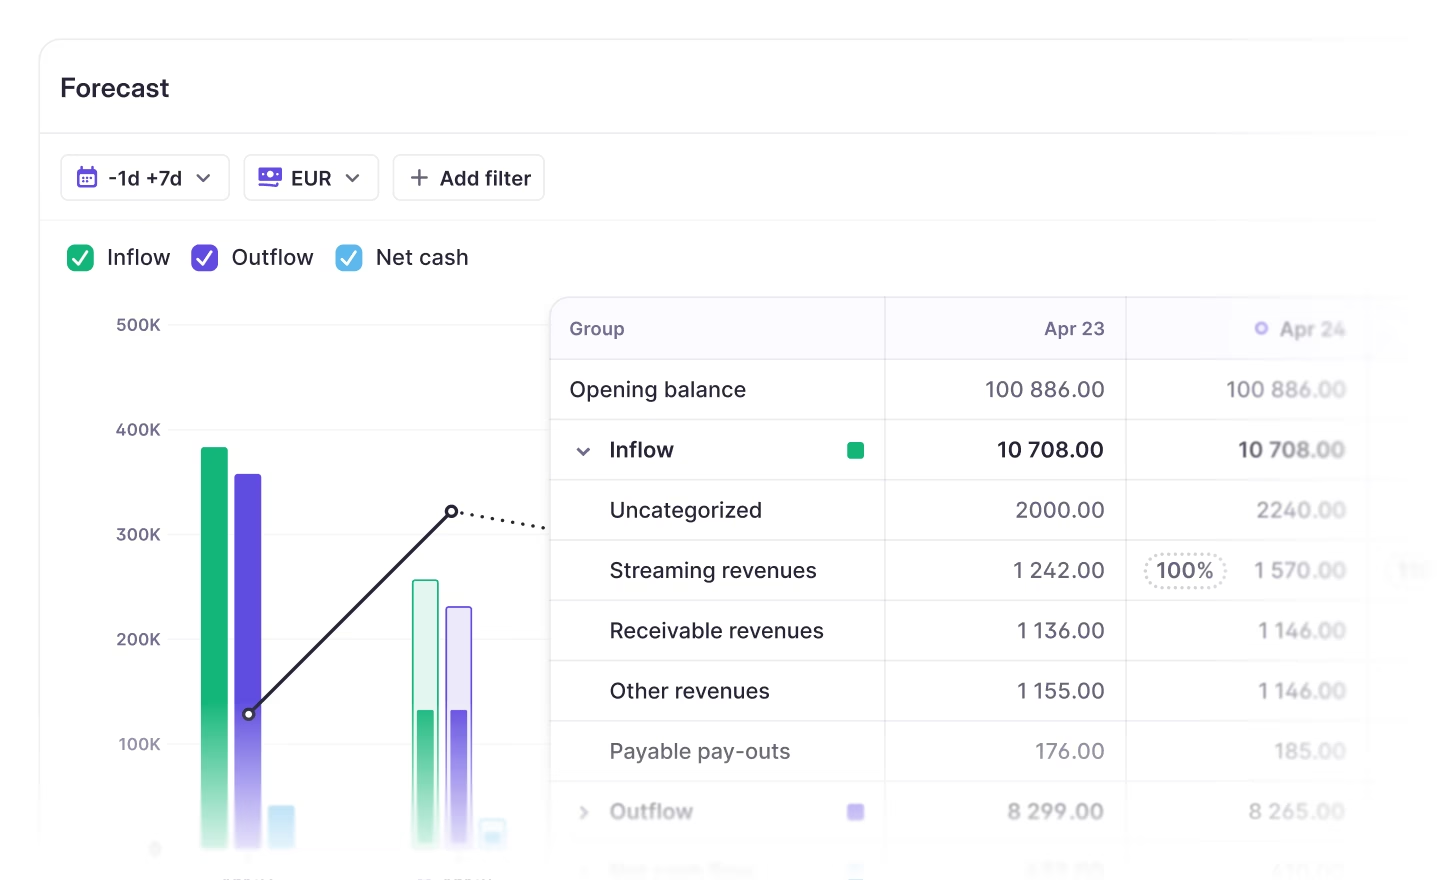
Atlar customers can use fully integrated variance analysis tools to easily compare forecasted and actual cash flows, helping to refine forecasts and improve accuracy over time. If this sounds potentially useful, book a 30-minute demo with our team to see Atlar’s cash flow forecasting solution.