Key takeaways
- View Builder is a cash reporting tool in the Atlar platform that lets teams analyze any financial dataset in a pivot table interface with chart visualizations.
- Users can save views as a table or chart, pin them to custom dashboards, reopen them later with updated data, and export views in CSV format.
- PDF export and automated report scheduling via email or Slack are described as coming soon.
- The workflow is: open the View Builder tab, select a dataset, organize it with pivot tables, choose values such as amount, count, or FX rate, visualize the data, then save, pin, or export.
- View Builder is built into Atlar, so teams can analyze cash balances, inflows and outflows, payment details, and currencies without exporting data to spreadsheets.
At Atlar, our goal is to help finance and treasury teams manage money with modern tools. By integrating with our customers’ banks, payment providers, ERP, and other finance tools, Atlar brings the full breadth of their financial data and payment activity into one place.
A key benefit of centralizing everything in the Atlar platform is the ability to access key insights faster, make better decisions, and avoid the tedious (and error-prone) task of exporting and reformatting data in spreadsheets.
That’s why we’re excited to introduce a major addition to our cash reporting toolkit: View Builder. Designed to bring Excel-like data analysis and visualization into the Atlar platform, View Builder enables teams to seamlessly analyze and visualize any financial dataset. Below is a short demo of how it works.
What is View Builder?
View Builder lets you analyze any aspect of your company’s financial data and manipulate it in a pivot table interface with rich chart visualizations. From cash balances to inflows and outflows, payment details, currencies, and more, it’s all at your fingertips.
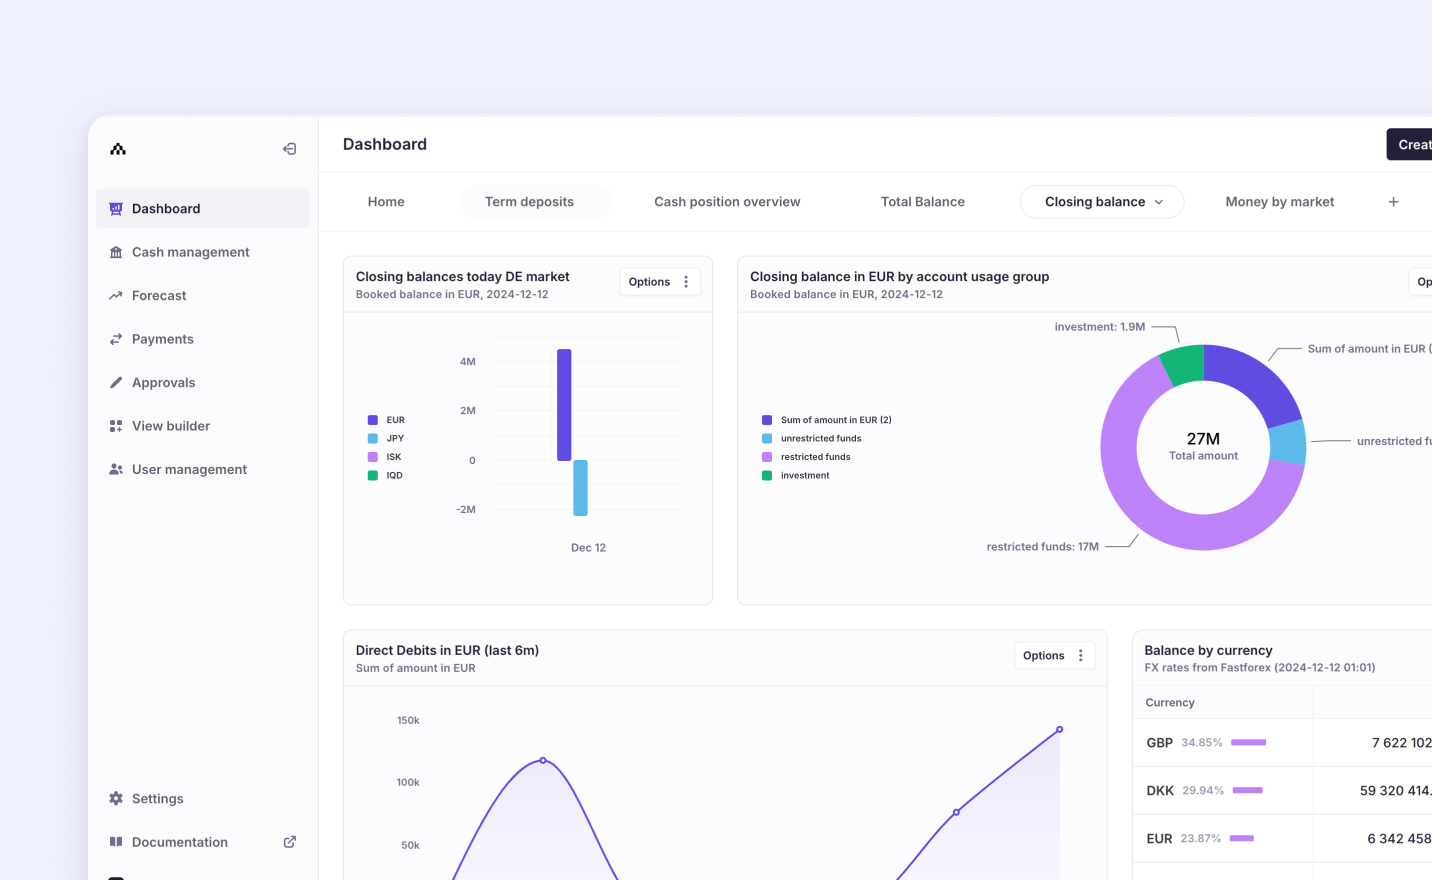
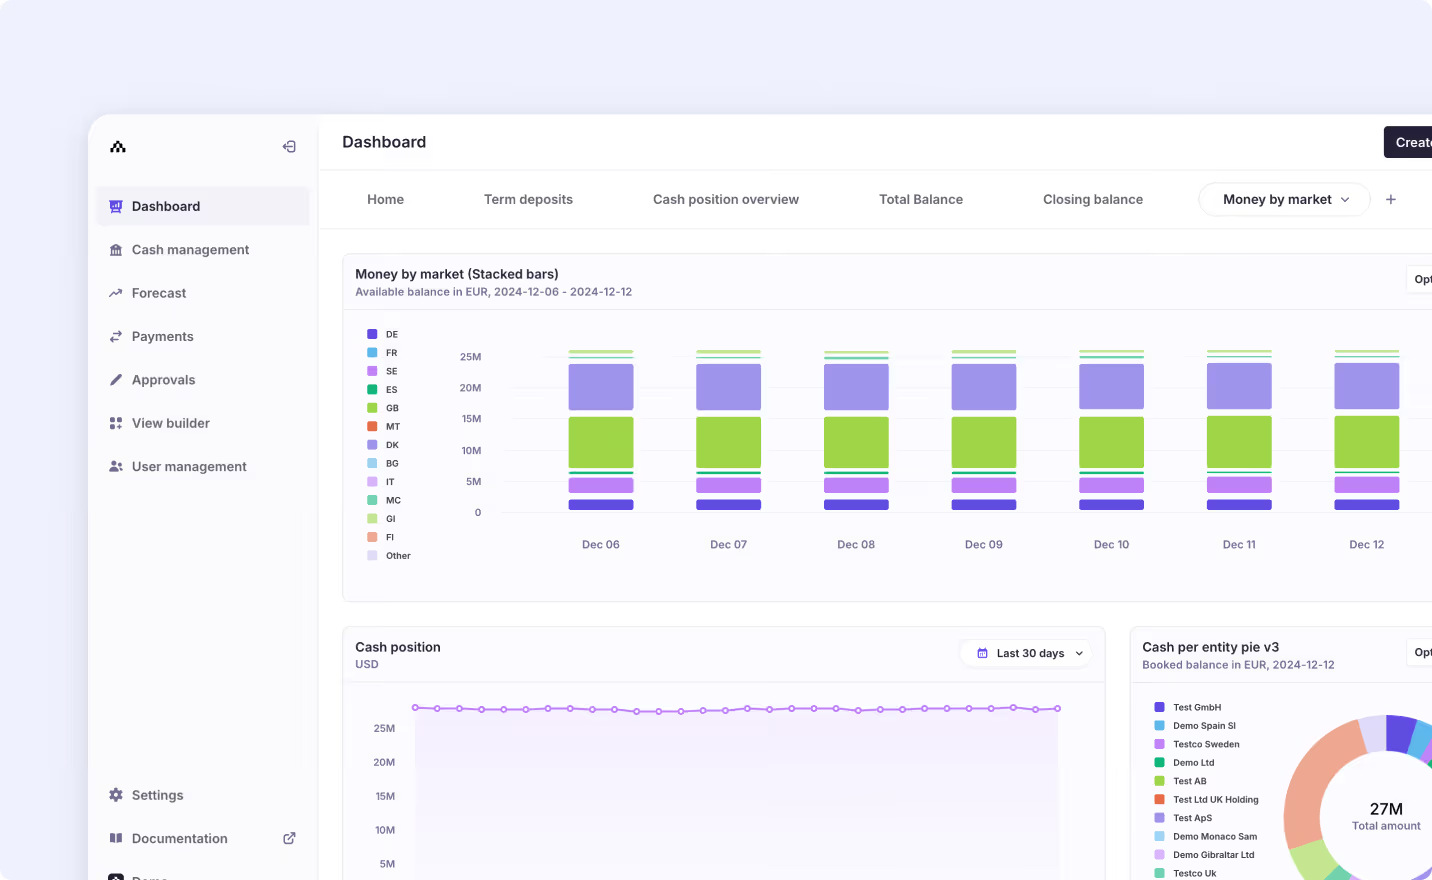
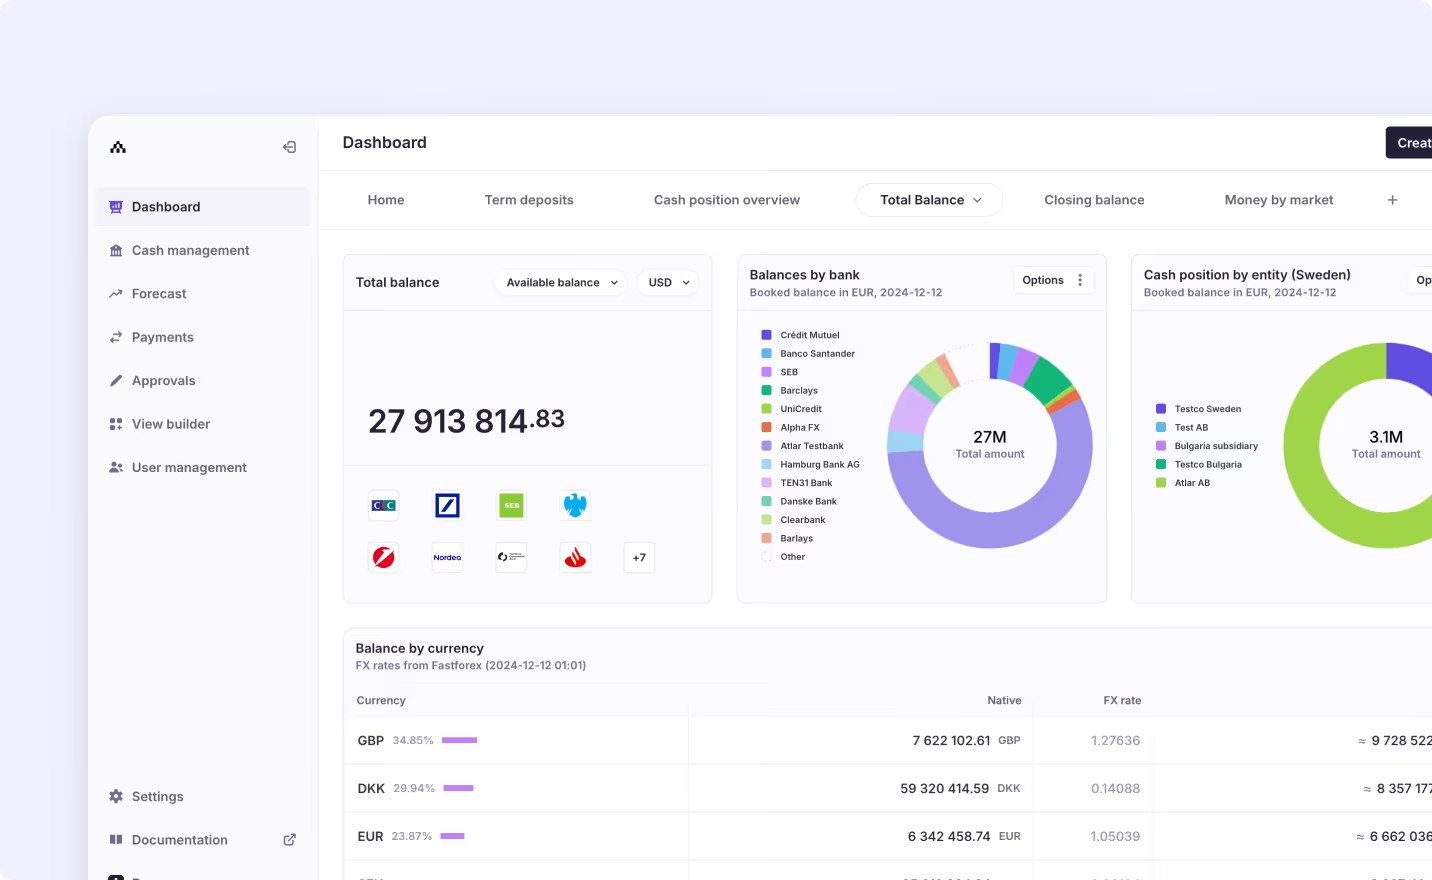
You can save views as a table or chart, choosing from multiple bar, line, and pie chart formats. Saved views provide easy access to up-to-date data, and you can pin them to custom dashboards or export the data to share with colleagues. This simplifies reporting and helps bring your data to life for stakeholders.
With View Builder, you can:
- Perform Excel-like analyses of any data set using pivot tables—no exporting or reformatting required.
- Visualize your data using multiple chart types to show the insights that matter at a glance.
- Save and pin key views to one of your dashboards for quick access.
- Access saved views at a later date and update them with the latest data, letting you spot trends or deviations and take action if needed.
- Easily export your views in CSV format—with PDF export and automated report scheduling (via email or Slack) coming soon.
How this helps our customers
For finance and treasury teams, quick access to insights can be the difference between being reactive and proactive when it comes to a company’s cash position. View Builder eliminates the hassle of moving data between systems and the limitations of traditional spreadsheets.
Here’s how it benefits customers:
- Faster insights and decision-making: Build custom views that show the data that matters to you, save them for future use, and pin key tables or charts to your dashboard.
- Streamlined reporting: Create polished visualizations with any data set and easily share them with key stakeholders, such as management. Views can be automatically updated with fresh data, simplifying daily or weekly reporting processes.
- Easier ad hoc analysis: Analyze the full breadth of your financial data in a fast, intuitive pivot table interface. With access to real-time cash flow and payments data, you can spot trends and take action faster.
Unlike static, spreadsheet-based reports, View Builder is built into the Atlar platform, giving you access to your complete financial dataset. No limits, no extra steps—just actionable insights.
How it works
Getting started with View Builder is simple. Once in the Atlar platform, you can:
- Navigate to the View Builder tab and create a new view.
- Select the dataset you want to analyze.
- Use pivot table functionality to organize the data into rows and columns.
- Select the values you want to show—such as amount, count, or FX rate—and the desired time period.
- Visualize the data using a variety of customizable chart formats.
- Save your view, pin it to a dashboard, or export it as needed.
See View Builder in action
Whether you’re monitoring cash positions, tracking outgoing payments, or identifying FX trends, View Builder helps you stay one step ahead. Ready to improve your team’s insights and decision-making? Book a demo to see it in action, or get in touch with our team.