Key takeaways
- Atlar has released UI improvements to the Dashboard and View Builder, including customizable chart colours and themes for entities, currencies, and banking partners.
- Dashboard widgets can now be resized, rearranged, and organized via drag-and-drop to highlight balances, payment statuses, and other financial data.
- Charts are automatically sorted by type: tables by nested groups and charts by value, with new stacked line, stacked bar, pie, and standard bar chart options.
- View Builder now includes smart chart suggestions, filtering by amount, counterparty, and description, and the ability to duplicate and modify existing reports.
- Admins can configure colour settings during onboarding and control access to theming so teams share a standardized colour scheme.
At Atlar, we know that every finance team has unique workflows, priorities, and ways of interacting with financial data. Many teams find Excel to be fast and easy to use, but its limitations stem from the fact that it only handles the data inside the sheet. This makes it difficult to import data, keep it updated, and ensure accuracy across multiple sources.
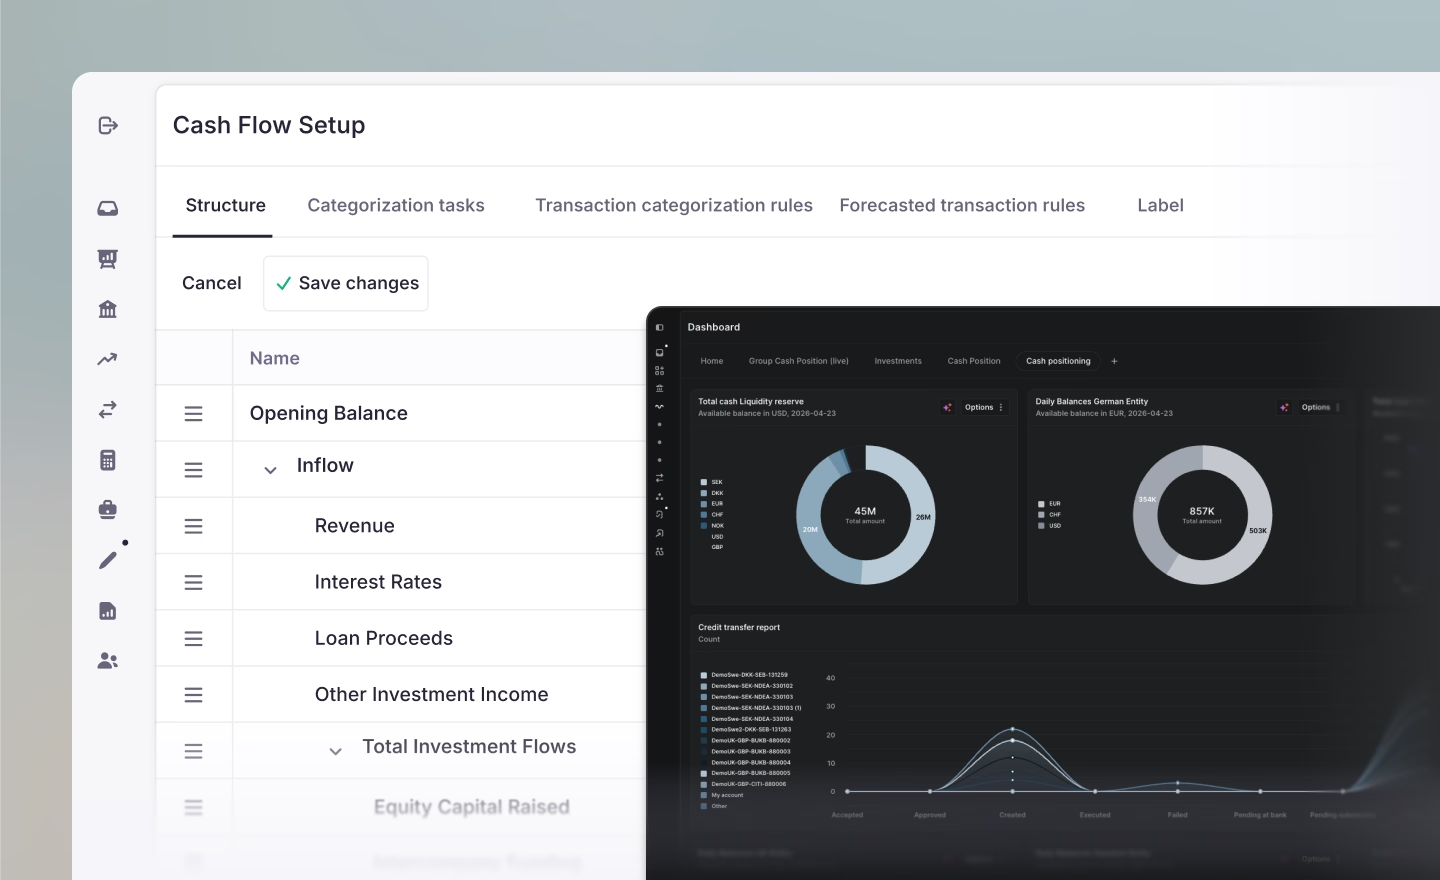
That’s why we launched View Builder—our cash reporting feature designed to match Excel’s speed and ease of use, but with real-time data access, dynamic updates, and 100% accuracy.
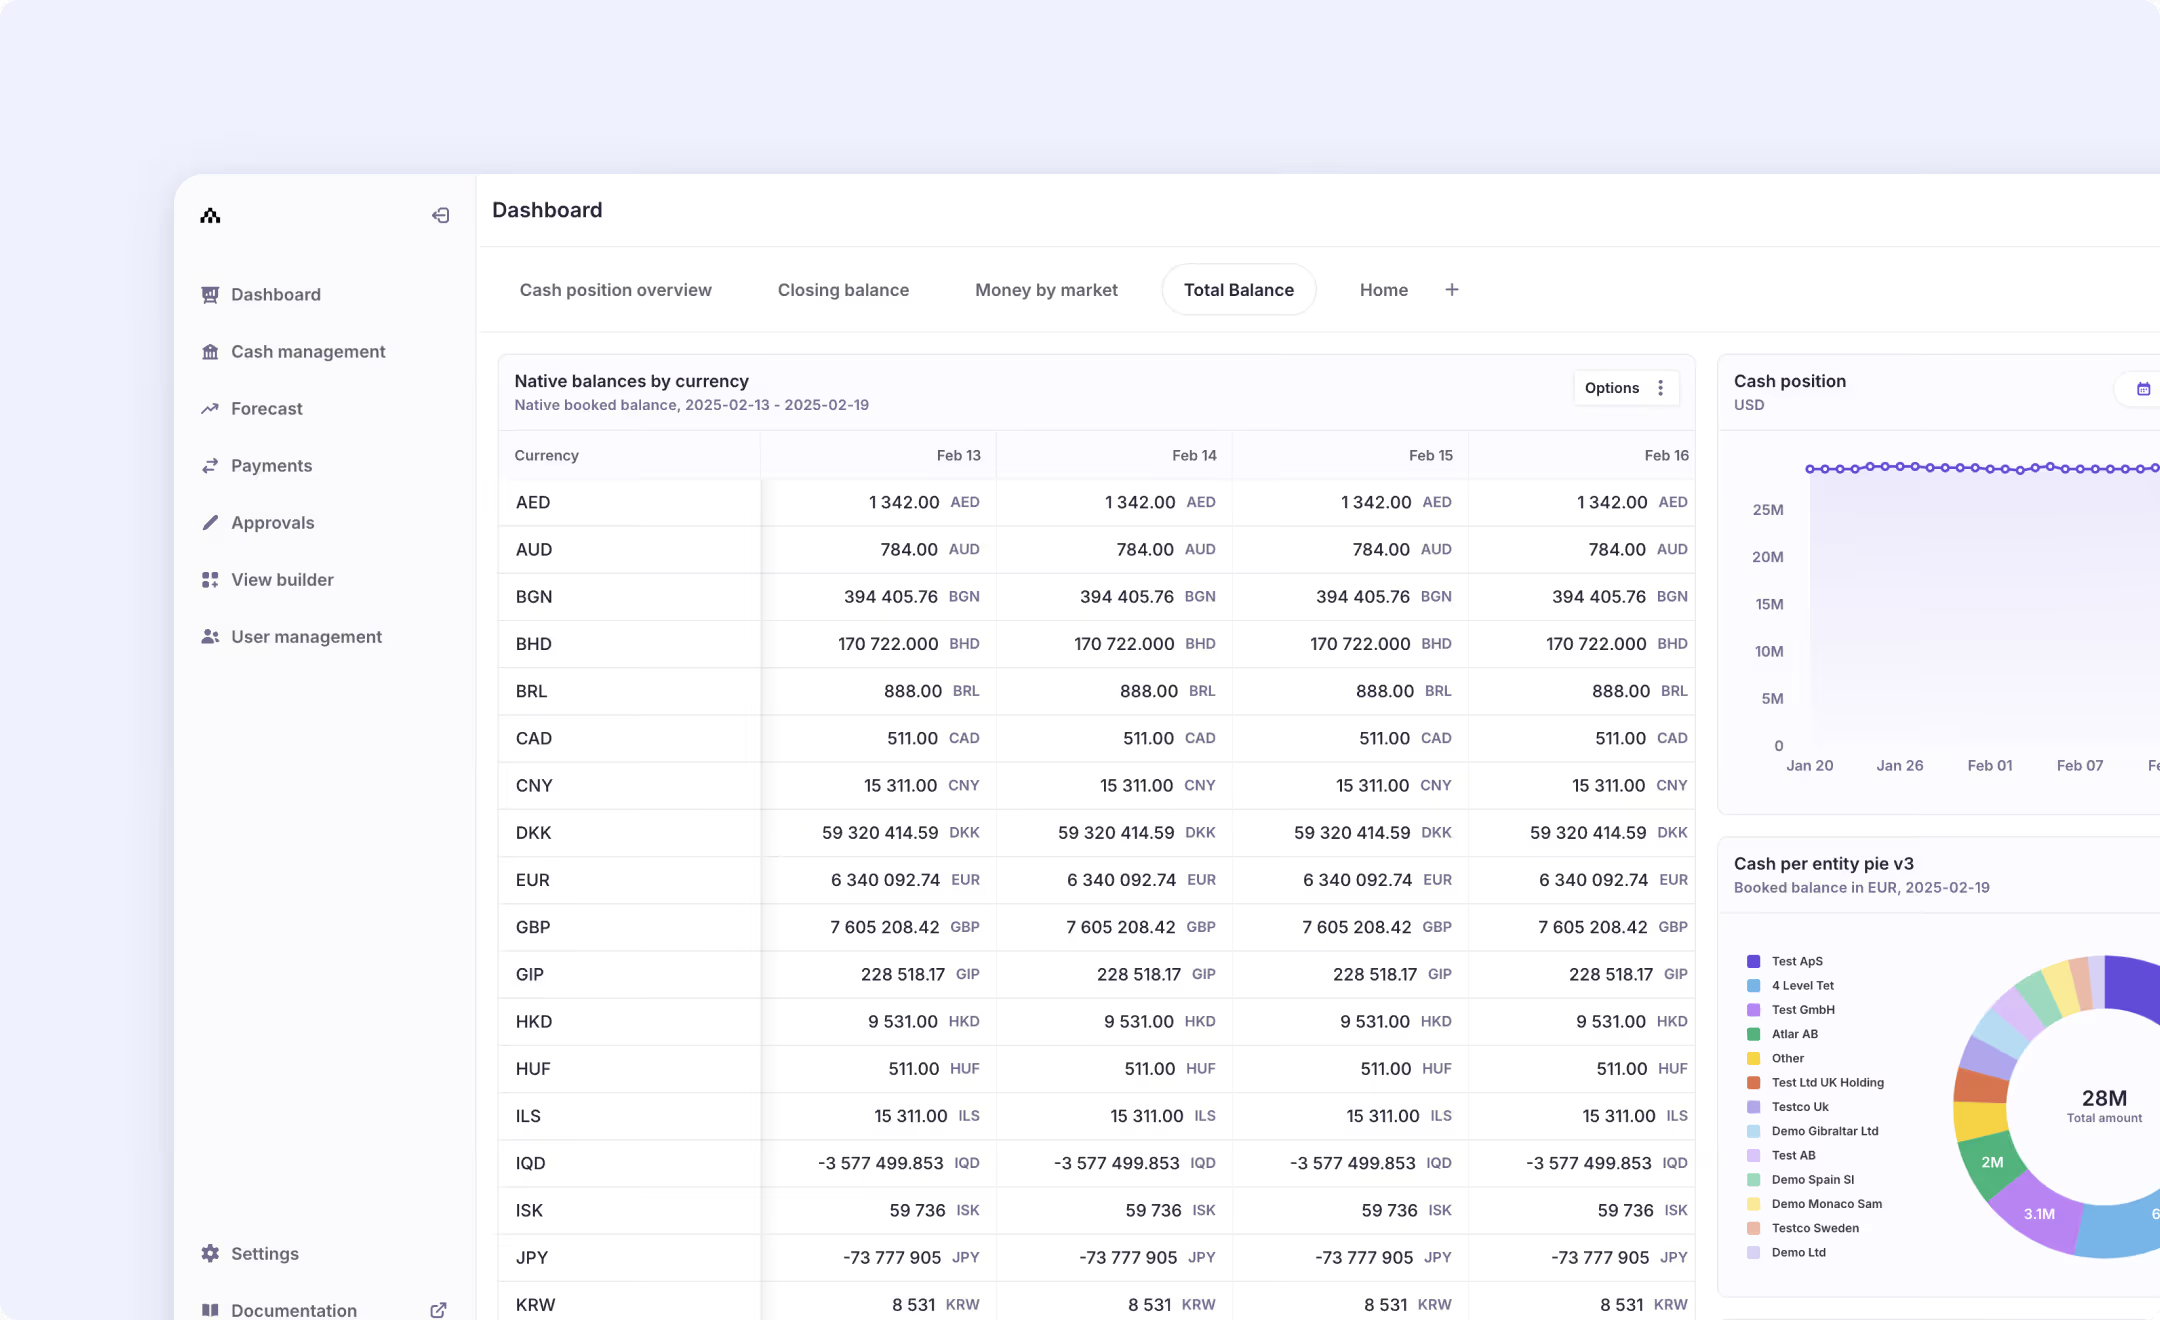
Now, we’re excited to share a suite of powerful new UI improvements to the Atlar Dashboard and View Builder, giving you even greater flexibility, control, and customization over how you manage and analyze financial data.
Customizable colour palette and theming
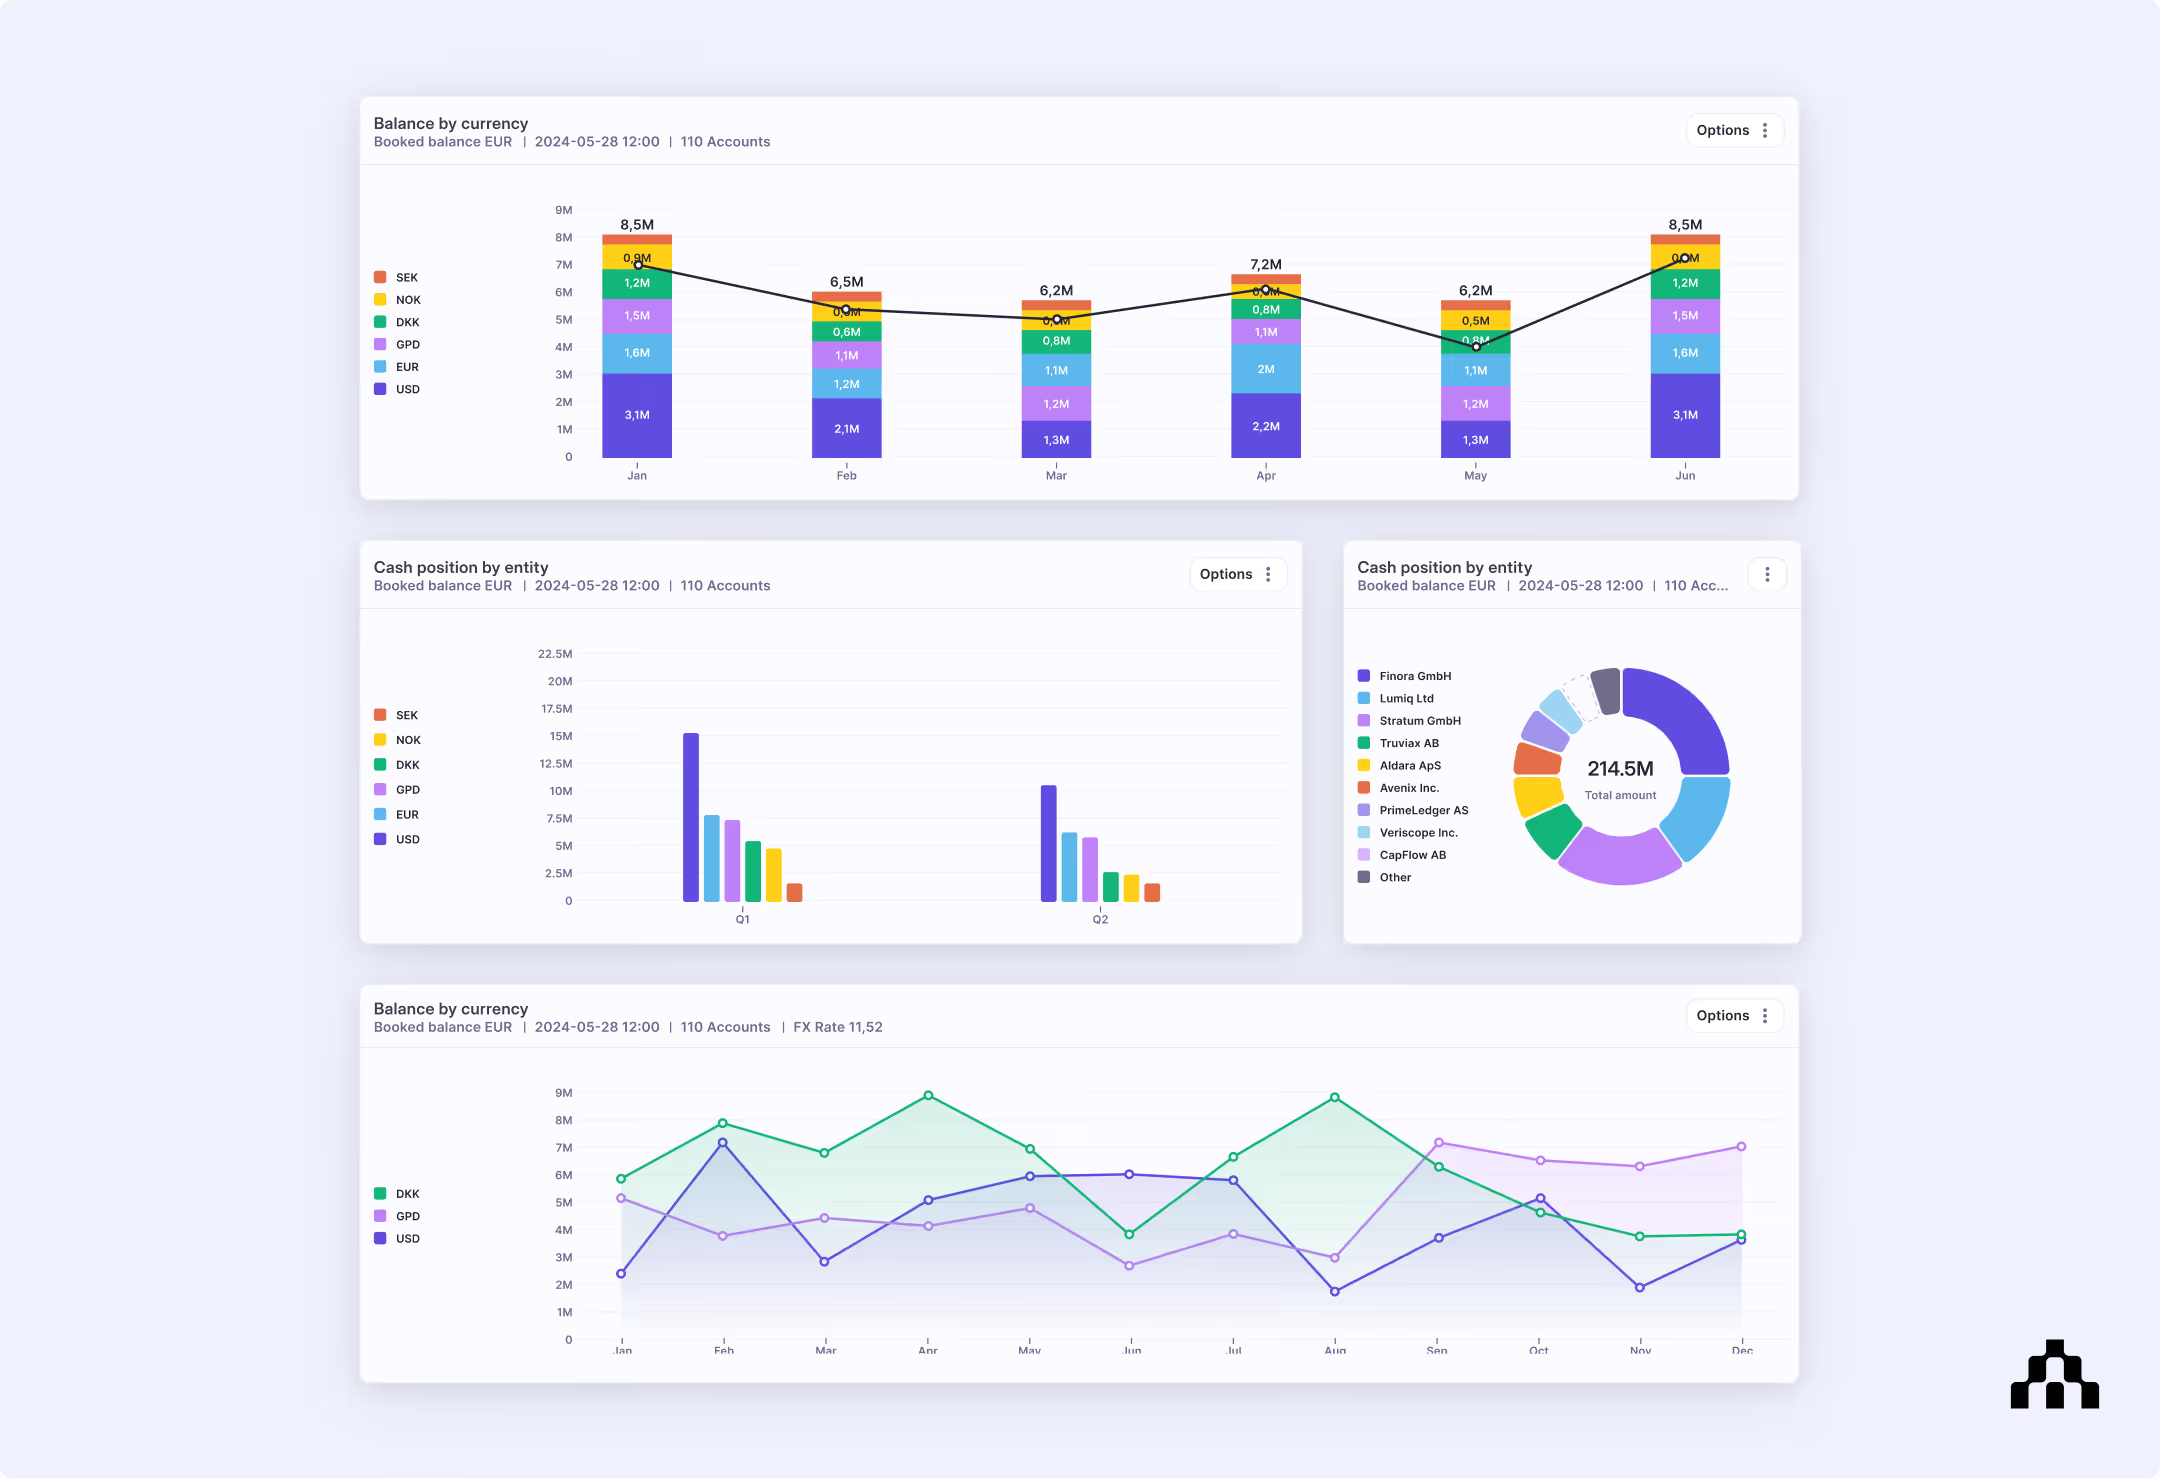
Your dashboard should reflect the way your team works. With our new customization options, you can fine-tune chart colours and themes, tailoring them to your company’s branding or financial reporting needs. Atlar now lets you set custom colours for specific entities, currencies, and even individual banking partners, so your reports remain clear and visually consistent.
Admins can configure these settings during onboarding and control access to theming, ensuring that new team members work with a standardized colour scheme that enhances clarity and efficiency.
Resizable, drag-and-drop widgets
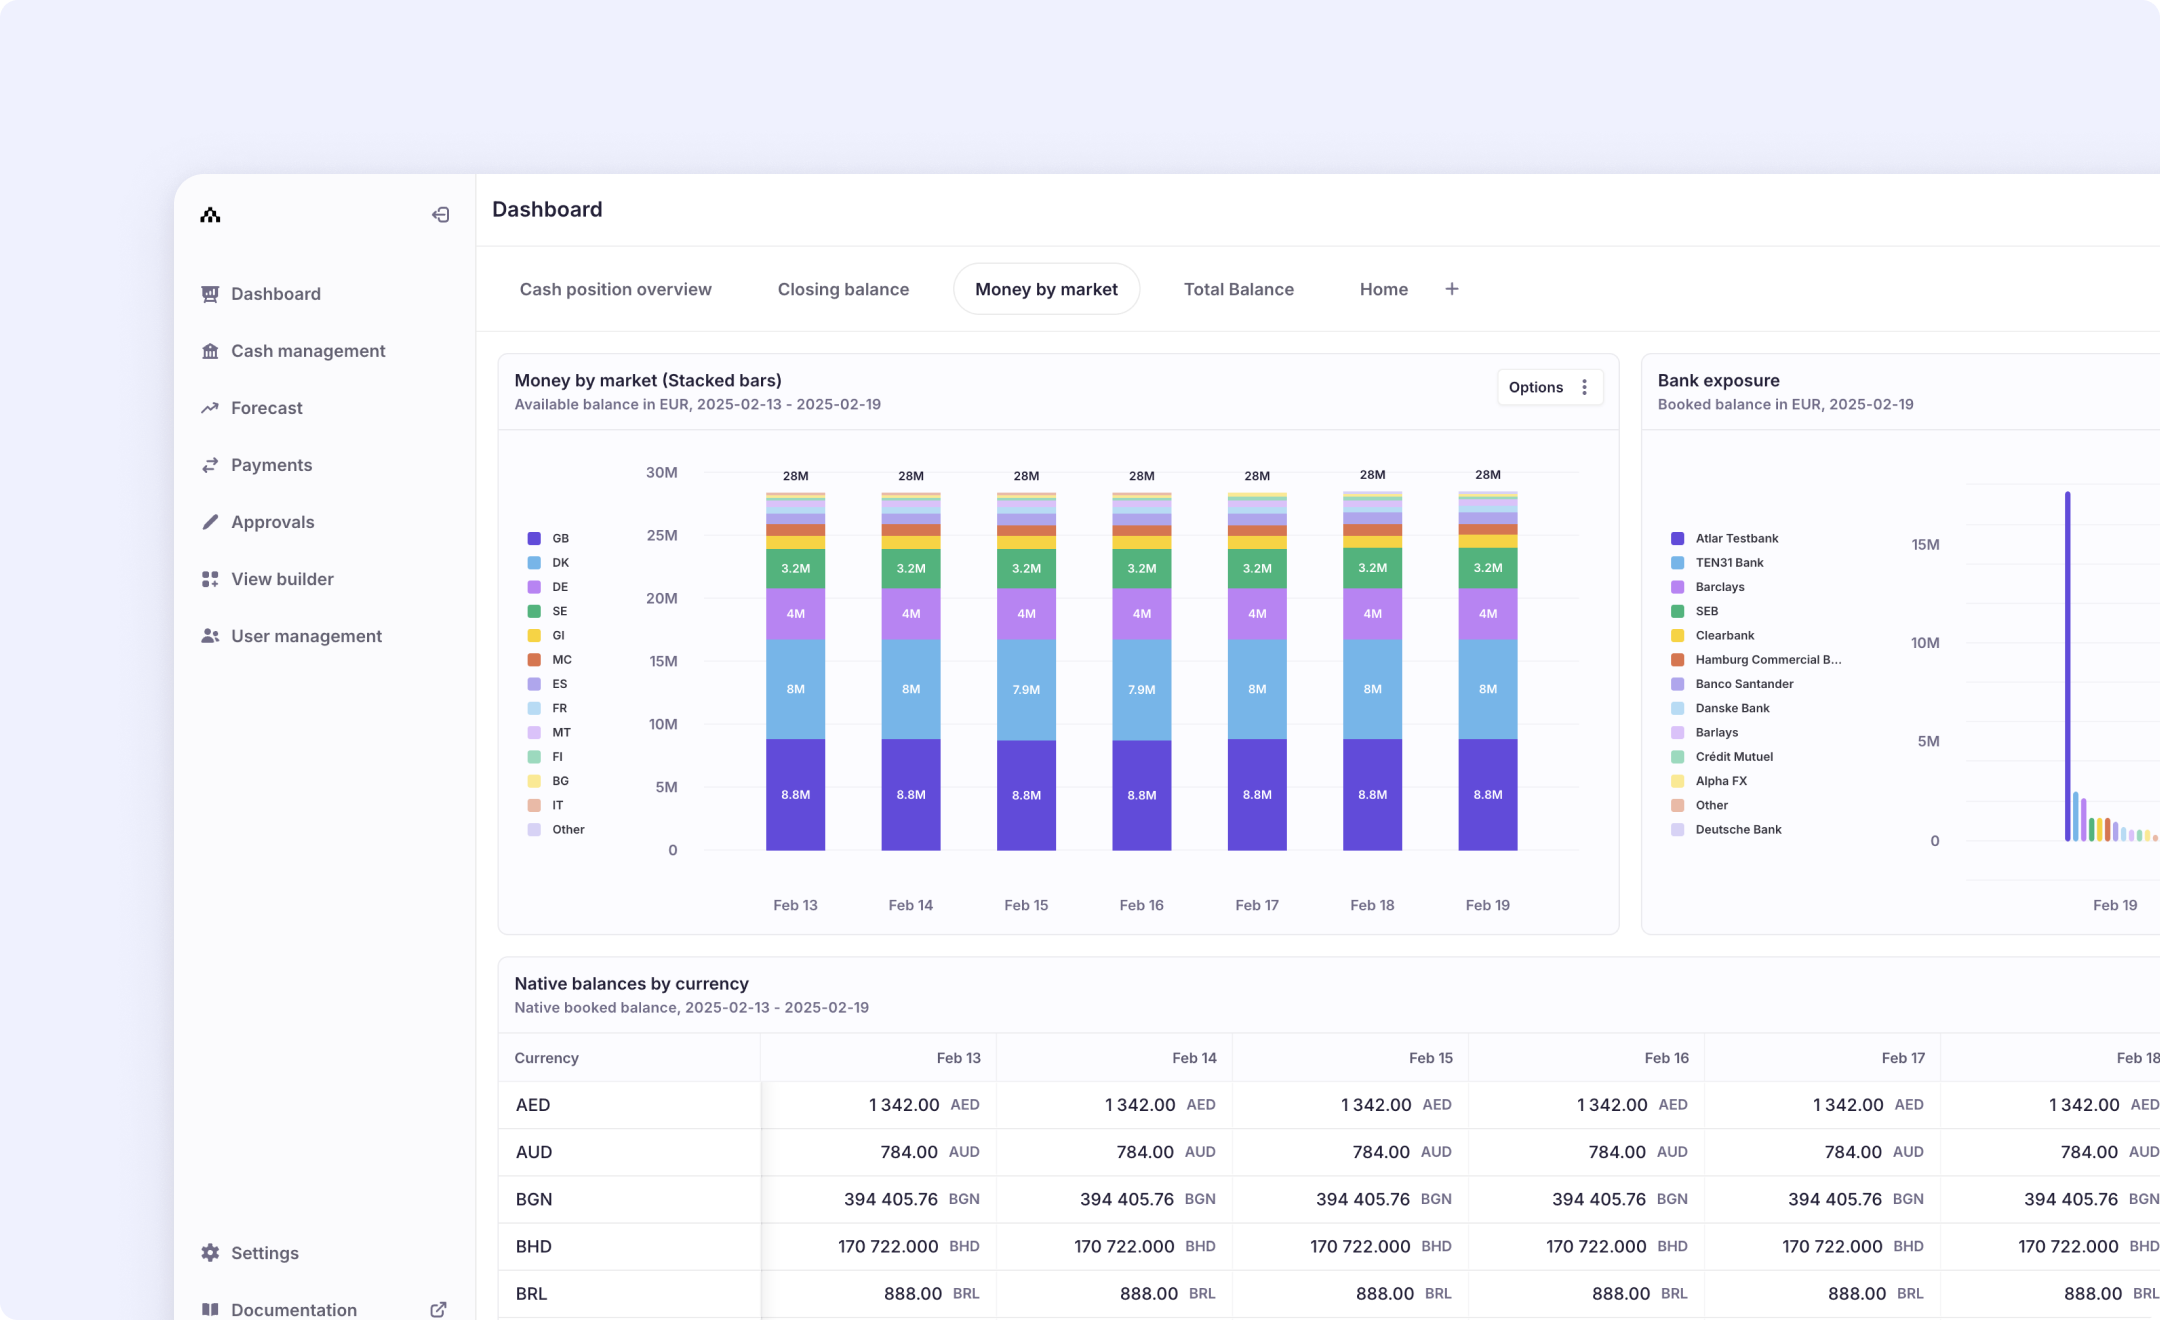
We’ve made widgets more flexible than ever. Now, you can resize, rearrange, and organize widgets on your dashboard to highlight the most relevant financial data at a glance.
Whether you need a large cash flow overview or a compact summary of upcoming payments, you can create a dashboard that reflects your priorities. By customizing your layout, you can view real-time balances, payment statuses, key financial insights, and more across all your banking partners and ERP systems in one place.
Smarter charts with automatic sorting
We’ve significantly improved chart creation and interaction in Atlar, making financial analysis more insightful and efficient. To ensure clarity and ease of use, we automatically sort data based on the chart type—tables are sorted by nested groups, while charts are sorted by value—helping you quickly surface key insights without extra configuration.
The latest enhancements include:
- New chart types and options: Now supporting stacked line and stacked bar charts, along with pie and standard bar charts, to enhance data visualization. Additionally, tables now allow you to view row groups as either a single column or multiple columns. Other improvements include:
- Tables: Display values as columns, similar to Excel’s layout for easier comparison.
- Bar charts: Options to show totals and display values directly on bars for greater clarity.
- Interactive hover details: Hover over chart elements to see exact figures instantly, making it easier to analyze trends and compare data.
View Builder enhancements for deeper analysis
We’ve enhanced View Builder to provide even more ways to analyze your financial data:
- Smart chart suggestions: Get automatic recommendations for new charts and reports based on what’s most commonly used by other teams.
- Advanced filtering across all visualizations: Now filter data by amount, counterparty, and description (in addition to currency, account, entity, market, and more).
- Streamlined report creation: Easily duplicate and modify existing reports, making it effortless to refine and expand your financial analysis.
Reporting that delivers real ROI for finance teams
Whether you're monitoring liquidity, forecasting cash flow, or reconciling transactions, the Atlar Dashboard puts you in full control of how you view and interact with financial data.
For our customers, this ensures tangible benefits in three key areas:
- Reduced risk of errors: Automation and smart reporting minimize manual intervention and human error.
- Better cash utilization: Real-time insights help teams forecast and allocate funds with confidence.
- More time for growth: By eliminating manual tasks in Excel and bank portals, finance teams can focus on strategic decision-making.
Experience the new Atlar Dashboard today
Leading companies like GetYourGuide, Acne Studios, Forto, and Zilch rely on Atlar to gain real-time cash insights, streamline operations, and make smarter financial decisions—all in support of business growth.
Curious to see how the Atlar Dashboard could work for your team? Book a demo with our experts and see it in action.